The Engineering Genius of the Nabataeans
This project perfectly embodies the Visualskies ethos of “capture, create, experience”, taking data seamlessly from initial scan to experiential design and live execution. By managing the full end to end 3D service under one roof, we are able to transform raw reality-capture data from one of the world’s most remote archaeological sites into an immersive, dynamic educational experience.
To understand why this project is so important, you have to appreciate the history and the environment. Petra is located in a region with little to no rainfall, making it too dry and barren to support much vegetation. Yet it was once a lush, vibrant, green city. The Nabataeans of Ancient Petra were known as thriving traders, but they were also masters of hydrological engineering.
The problem in Petra was long periods of drought, interrupted by sudden, violent flash floods. To solve this problem, the great minds of Petra carved over 100 miles of intricate networks of dams, cisterns and ceramic pipelines into the sandstone cliffs. Every drop of the 4 inches of annual rainfall was captured and produced 12 million gallons of water daily, which was distributed to the estimated 30,000 residents of Petra.

To truly do justice to this ancient marvel, the team at Visualskies provided a comprehensive, full-service pipeline, moving from high-fidelity reality capture on-site, through digital story creation and simulation, to a final, physical presentation designed as an immersive museum piece. By managing this entire workflow under one roof, from pre-production planning through to post-production and final execution, we eliminate the friction of multi-vendor handoffs, ensuring the entire project runs predictably, remains highly cost-effective, and meets strict project deadlines.
Phase 1: High-Fidelity Data Capture Using LiDAR and Photogrammetry
Capturing a site as vast as Petra requires a lot of planning, a lot of tech and a lot of data. To begin the first phase of our end to end 3D service (creating the digital twin of the ancient city) the team at Visualskies used long range LiDAR scanners, and high spec cameras mounted to drones.
Our work in the Petra Hinterlands presented a significant number of challenges for the three strong team from Visualskies, a UK headquartered company specialising in creating digital reproductions of real world people, objects or in this case locations. Working to create useful digital representations involves two distinct components; capture, the physical surveying of the location and processing, turning raw data into something useful with each component containing its own unique challenges.
When accessing a site such as the Petra Hinterlands for digitisation, invariably the first question we must ask ourselves is in what way will any data collection be utilised? The answer to this allows us to select the most appropriate equipment and expertise, allowing for a smoother pipeline and pre-empting any post-production hiccups. Because we manage the eventual post-production internally, our pre-production planning is incredibly precise; we only capture what we know we need, saving valuable time on-site and significantly reducing overall project costs. For the location at Petra, the data was to be used to help further the archaeological team’s understanding of how human scale interventions affect the larger landscape as a whole as well as providing a visual tool to help understand the vastness of the landscape and location of important anthropological components.
By having a good understanding of what the end result was going to look like, the team at Visualskies were able to plan the capture stage down to the finest of details. This rigorous front-end planning means we can accurately predict delivery timelines, mitigate environmental risks, and guarantee that the raw data formats perfectly align with our creative team’s needs later on.
Combining LiDAR and aerial photogrammetry was the only way we were going to completely capture the area, from the tops of the sandstone peaks to the pits of the carved out cisterns. We opted to utilise long range (1km) ground based LiDAR to give scale to the photogrammetry. The LiDAR positions were stationed at vantage points to connect the 5 unique sites together with accuracy and to create one overall model of the entire site. The LiDAR captures millimetre accurate geometry data of the area visible from the ground. It maps the precise slopes of the water channels that are often invisible to the naked eye in the barren sandscape.
The drone photogrammetry allowed for the capture of the high-altitude summits where the primary catchment basins sit. Photogrammetry is particularly effective for rocky landscapes because rocks are “feature-rich.” Unlike a smooth sand dune or a uniform grassy field, rocks provide the high-contrast, complex textures that are perfect for processing 3D digital representations. By collecting thousands of aerial photographs and hundreds of LiDAR scans we completed the initial capture stage, collecting the data that will preserve the site exactly as it exists today.
Phase 2: Processing and Story Creation – Turning Raw Data into Narrative
Over the course of a week on site, the team captured in excess of 15,000 61 megapixel images alongside the roughly 150 LiDAR positions totalling approximately 20 terabytes of raw data.
The data in its rawest form is fairly useless. To transition from raw capture to meaningful story creation, we first manually aligned all of the LiDAR scans by drawing control points in each scan set. This allows us to ensure there’s an accurate base survey to work from. The terrestrial LiDAR is accurate but given the occlusion created by the landscape is naturally missing data and is also fairly limited in providing any sort of life-like visualisation.
As such we took the drone and terrestrial photography and essentially draped it over the LiDAR pointcloud to create high quality textured geometry and fill in any of the occluded areas. The result is a general GSD (Ground Sampling Distance) of 5cm across the entire 3X6km site and 3cm (or lower) at the 5 individual sites. In real terms this means we can distinguish a pebble in a scan area the same size as the City of London.
At this stage the data (now 3D models and associated texture files) is still fairly useless to anyone without a fairly large computer or understanding of 3D. Because our field team works hand-in-hand with our processing team, this stage moves incredibly fast; there is no guesswork or back-and-forth communication delays about how the data was gathered. To find the narrative hidden within the geometry, we partnered with leading minds at the University of Chicago and Brown University to bring this data into the academic field.
For these professors our 3D scans are used as primary sources of research and analysis. We elected to host the models online using a pixel streaming service that allows users anywhere in the world to quickly and securely remote into any part of the model. The tool allows easy analysis of accurate and visually rich data where the user can easily understand both the scale of the site with the ability to zoom in to human sized interventions.
The possibilities of using 3D scans in this way are endless. Students and fellow researchers can walk the sites in VR, making inaccessible areas accessible to anyone. It also opens up possibilities of contextual learning, where instead of looking at 2D maps, researchers can look at the area as a whole and analyse the relationships between the mountain peaks and the valley floors in a spatially accurate environment.

Image shows aerial photogrammetry camera positions and raw pointcloud
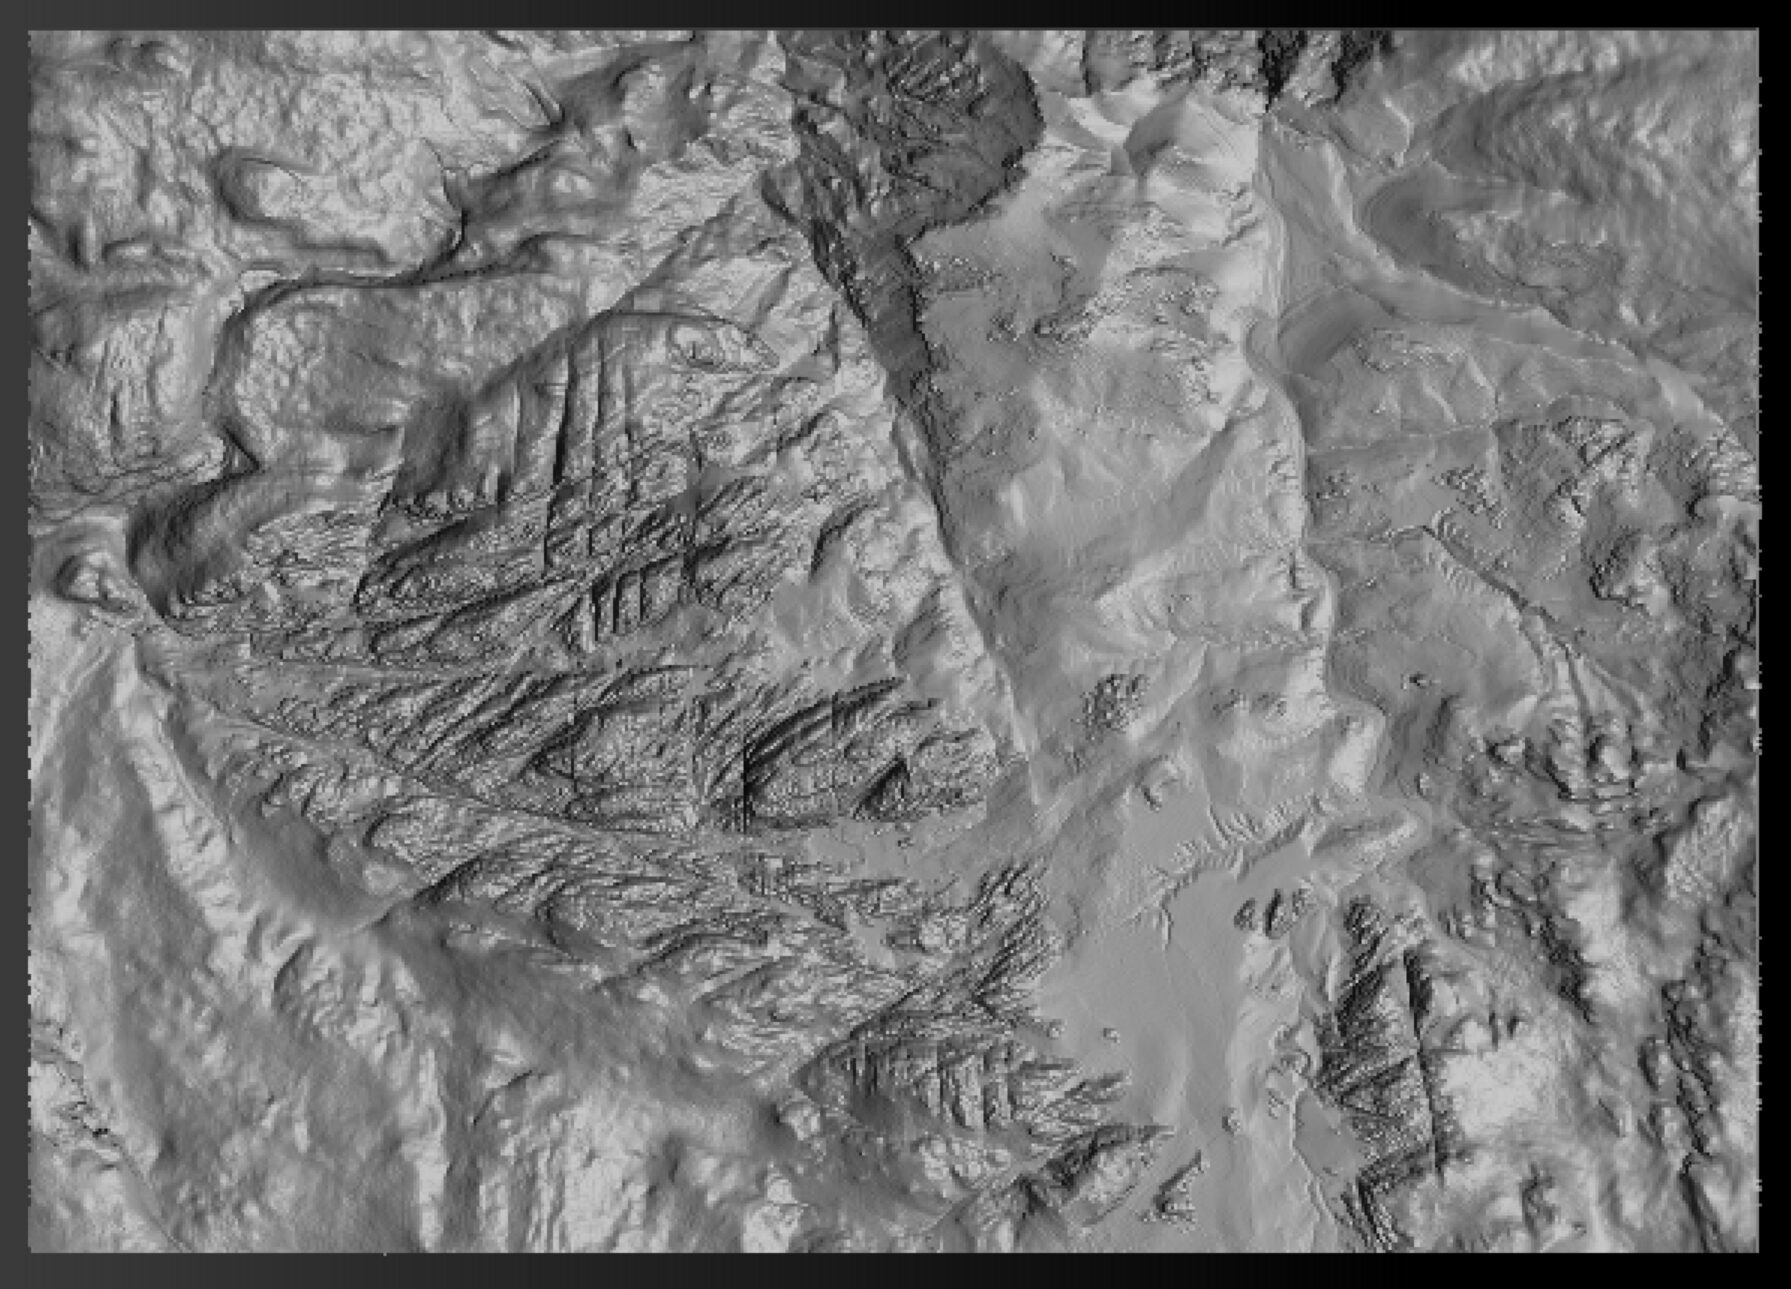
Image shows mesh reconstructed from terrestrial LiDAR and aerial photogrammetry

Image shows orthographic view of reconstructed mesh textured with photogrammetry
Bringing the Water Back: Water Simulation on 3D Scanned Environments
At Visualskies, we like pushing the possibilities of what we can do with the data post-capture. To elevate our story creation, we combined our data with computational fluid dynamics. The team at Visualskies used Storm HydroFX to create lifelike fluid simulation, and by taking our complete digital replicas and running these simulations, we could essentially turn on the rain.
By simulating the rainfall we can see exactly how water flows off the rocks and into the Nabataean channels. The simulations show how quickly the cisterns would fill up and how the dams prevented the city from becoming flooded. So unlike 2D drawings, this data doesn’t just show us what the ruins look like; it tells the narrative of how they worked.
Video shows Visualskies asset with water simulation
Phase 3: Presentation – Crafting an Immersive Museum Piece
The final phase of our full-service approach was bringing the digital models and engineering stories back into the real world, translating complex data into a public-facing museum installation. Because our team oversaw the pre-production data capture with this specific physical display in mind, the transition from digital asset to physical fabrication was completely seamless, eliminating the costly trial-and-error often associated with 3D printing complex terrain.
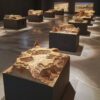
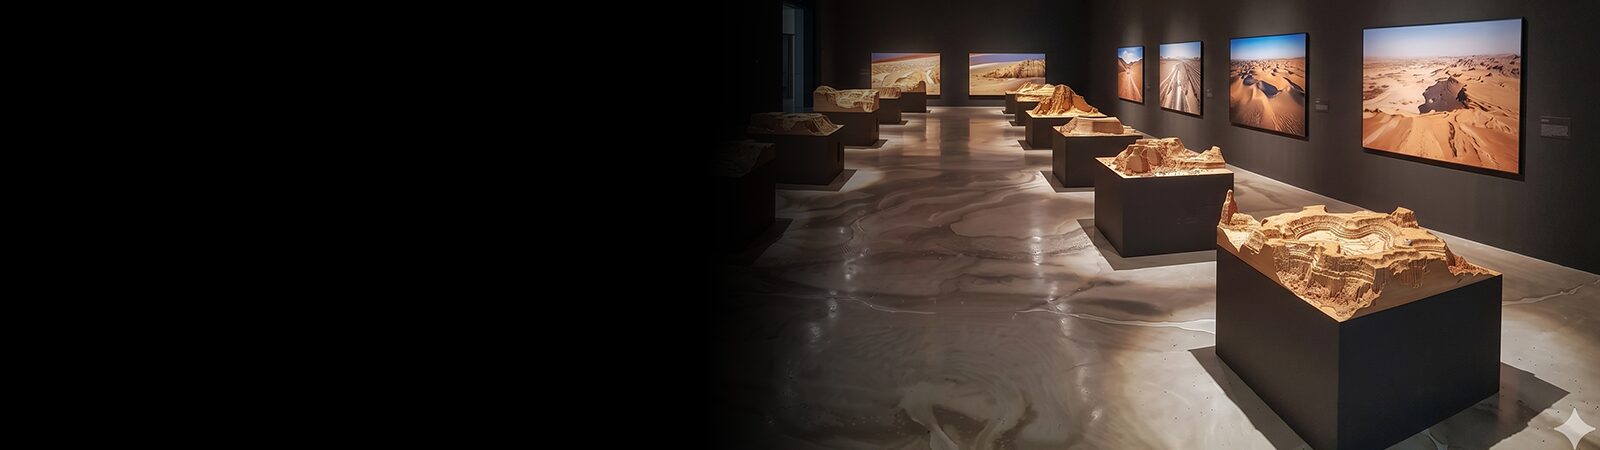
Back in our London office we created large-scale 3D printed topographical models of the Petra basin. We sectioned the terrain into tiles and printed them with extreme precision using the Bambu Lab A1 Mini. Every single elevation change and hand carved channel has been preserved in plastic, halfway across the world from the real thing.
But, the real magic happens when we combine these physical models with Projection Mapping for the final presentation. By aligning our digital water simulation perfectly onto the 3D printed geometry, we can project the rainfall directly onto the model.
Museum observers are able to watch as the digital rain hits the peaks and naturally funnels into the carved Nabataean channels, exactly as it would have thousands of years ago. By owning the entire pipeline from capture, to story creation, to presentation we have seamlessly created a living map that has transformed a static archaeological site into a dynamic, educational exhibition experience that celebrates the ingenuity of the Nabataeans.
Through the lens of Visualskies’ end-to-end technology and creative service, Petra is no longer a “lost city”, but a reclaimed, interactive masterpiece of ancient human creativity.
Video shows 3D printed Visualskies asset with projection mapped texture and lighting changes
Looking Forward
Petra Exhibition was a project that reminded us why we do what we do. It stretched our technical muscles, deepened our cultural awareness and gave us the chance to contribute to a story beloved by audiences around the world.
At Visualskies, we’re always chasing the next adventure – the next challenge that requires equal parts art, science and human intuition. We’re more ready than ever to keep capturing the world’s wonders – one scan at a time.
👉 Follow us on Instagram 👉 Like our Page on Facebook 👉 Subscribe to our YouTube Channel 👉 Connect with us on LinkedIn
WHERE TO FIND US?
Visualskies is proud to offer our expert Photogrammetry services for VFX across multiple locations worldwide. Our presence in key cities enables us to provide prompt and efficient service to our clients. You can find us in the following locations.
GLOBAL BASES
LONDON
Unit 4S Hewlett House, Battersea
SW8 4AS, UK
BERLIN
Wilhelminenhofstrasse 92
12459, Germany
NYC
546 West 48th St
NY 10036, USA
ITALY
Via Fratelli Lumiere, 86/c
52100 Arezzo
HONG KONG
20 Wang Hoi Road
Kowloon Bay, HK